Real world walkthrough with WinDbg
Most of the work I currently do (during the day) is with WinForms applications and most of the time, debugging their problems really isn’t all that hard. Application hangs or crashes that only occur on one machine at a remote location are not easy though. We ran into one of those situations a few weeks back. I told our support group that if they saw the hang again to let me know and I would swing by so that we could get a memory dump of the application and start debugging it. Here’s everything I did to figure out what went wrong.
First thing, install Debugging Tools for Windows. This will get you things like adplus and windbg. Make sure you pick the right version for your platform (i.e. x86 or x64) because the debugger has to match the platform you’re debugging on. I already had it installed on my machine, but I shared the directory so that I could access the tools on the remote machine that was having the hang.
Next, I remoted into the machine with the problem and ran
adplus to get a memory
dump. To do this, I first copied over the debugging directory to the remote
machine from my share. Luckily, the Debugging Tools can be copied and therefore
don’t need an MSI or setup executable. To get the dump, I pulled up a command
prompt, moved to the debugging directory, and ran adplus -hang -p 3423 where
3423 was the process ID for the application that was hanging. If you’re dealing
with an application that is crashing, you would need to pass different
arguments in. By the way, note that adplus is just a VBScript - this means that
you can open it and see what they’re doing if you’re so inclined. You can get
the PID from either task manager or process explorer.

Let this script run to completion and it should create the memory dump (in this case, a minidump) in a directory that looks something like this:

I then zipped up this directory and copied it back over to my machine so that the user could get back to work :-) Get back to your desk because you’ll be able to do everything else there.
This is where it gets fun, because we get to use WinDbg. Before doing any real work with WinDbg, I would strongly recommend getting your colors customized because it is very hard to spot errors or warnings when all the text is black on white. Check out Tess’s post on setting up a custom workspace for WinDbg. I set up WinDbg exactly as she did in the post and it works quite well.
Next, you can open your minidump. Under the File menu, there is an “Open Crash Dump” command that you can use (Ctrl+D for you keyboard guys) so pull that up and open your minidump file. It should look something like this:
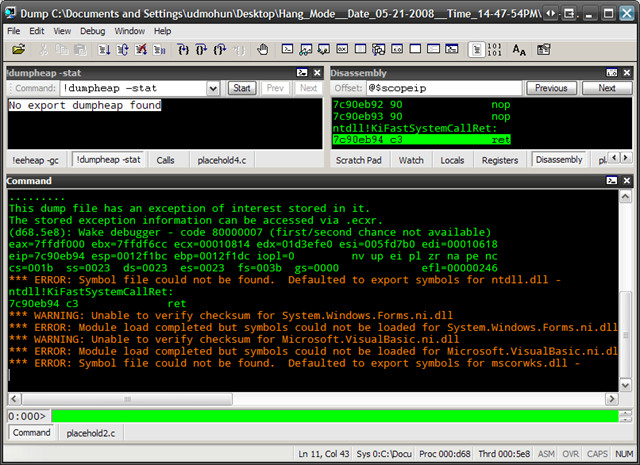
You can think of WinDbg sort of like a command prompt, even though it has windows and buttons. It is just as user friendly as the command prompt is when you’re sitting at the C: prompt. In other words, it isn’t friendly at all. In this case, instead of a C: prompt, you have the prompt at the bottom of the screen.
WinDbg starts out as an unmanaged/native debugger, which means you could debug
your managed application, but it will be fairly difficult with just native
commands. What you need to use is a tool called
SOS. John
Robbin’s, master debugging guru
guy, has an
excellent MSDN Magazine article on
SOS that you
should read for more information. My next step was to load up the SOS extension
in WinDbg by typing .loadby sos mscorwks which tells WinDbg to load the SOS
extension from the same directory as the mscorwks assembly was loaded from.
(check out this comment for cases when the loadby might not
work,
such as when mscorwks hasn’t been loaded yet)

When I typed it in, I unfortunately got an error, though (pasted below for Googlibility, if that’s a word).
PDB symbol for mscorwks.dll not loadedFailed to load data access DLL, 0x80004005Verify that 1) you have a recent build of the debugger (6.2.14 or newer)            2) the file mscordacwks.dll that matches your version of mscorwks.dll is                in the version directory            3) or, if you are debugging a dump file, verify that the file                mscordacwks_<arch>_<arch>_<version>.dll is on your symbol path.            4) you are debugging on the same architecture as the dump file.                For example, an IA64 dump file must be debugged on an IA64                machine.
You can also run the debugger command .cordll to control the debugger'sload of mscordacwks.dll.  .cordll -ve -u -l will do a verbose reload.If that succeeds, the SOS command should work on retry.
If you are debugging a minidump, you need to make sure that your executablepath is pointing to mscorwks.dll as well.
This got me digging for a while to figure out why I couldn’t load up SOS. Quite a few other people were curious, too. The gist of it can be summed up in this Microsoft Connect post, which details that you have to have the exact same version of the .NET Framework as the machine where the minidump was taken. In short, I had installed .NET 3.5 on my machine which included patches to .NET 2.0 while the user who was having the problem was a few versions back.
To confirm this, you can use the loaded modules command (lm) to see all of the
modules that were loaded at the time of the minidump. I specifically used lmv m mscorwks. The ‘v’ apparently means details or something and the ‘m mscorwks’
tells the command to match on modules named ‘mscorwks’. Here is the result,
with the file version info from my local mscorwks file as well (found in
c:\windows\microsoft.net\framework\v2.0.50727).
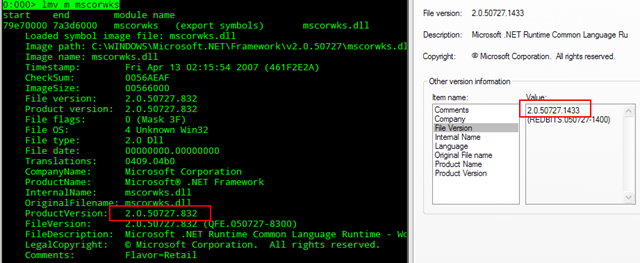
Don’t despair if you’re in this situation, because I have a solution. Virtual machines! It takes a bit of work, but you can get a VM set up with the same framework version. I started out with blank Windows XP SP2 VM and installed the .NET Framework 2.0 RTM on it. Turns out, I was still off. The below screenshot is from the VM.
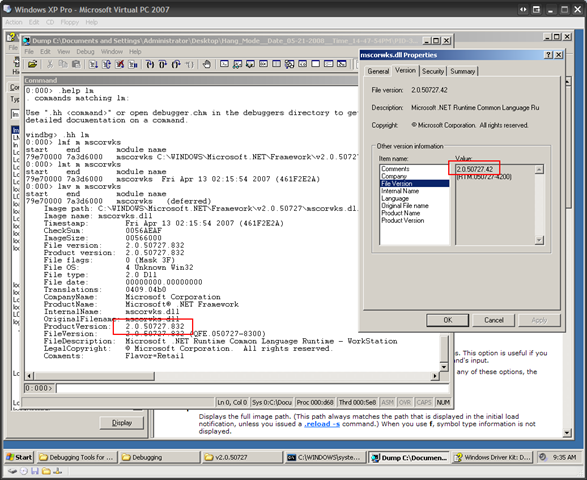
I was starting to get frustrated at this point, but Doug Stewart saved the day with a couple of posts on .NET 2.0 versions, one on .NET 2.0 revisions and one on the version history of the CLR 2.0. I was able to determine that the problem computer was running a patch from KB928365. I installed the patch on the VM and… SUCCESS! SOS loaded up!
With SOS loaded, you run a lot more interesting and powerful commands from WinDbg, like !threads, !CLRStack, !analyze and more. Here are the basic steps I took to attempt to narrow down what was going on.
I ran !threads, which displayed all of the threads that were running at the time the minidump was taken.
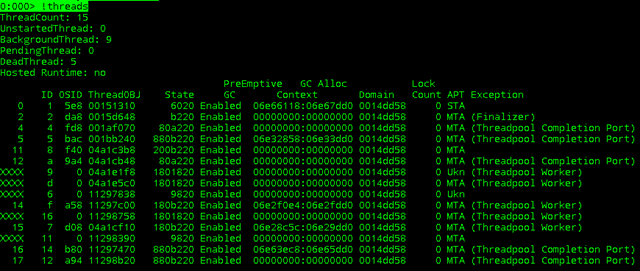
You can see that, though it looks like a lot was going on, there really was the main STA thread (the thread that contains the WndProc which pumps the Windows messages) and a lot of system threads like the Finalizer threads and Completion Port threads.
You can switch between threads, by using the ~[THREAD]s command, like ~11s, which switches to the thread with the ID of 11. Once switched to a thread, you can run !clrstack and get the call stack for that thread.

It looks like thread 11 was an animation timer. Back on the main thread (STA), it really just looks like normal WndProc activity - nothing too strange.
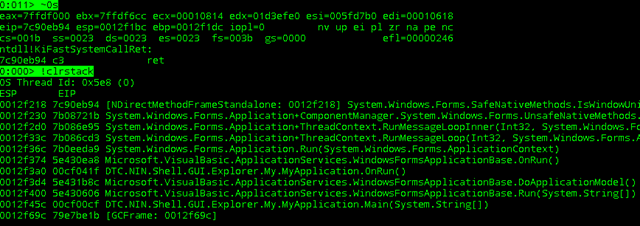
It was looking like I wasn’t getting anywhere, so I decided to try something else. I ran the DumpStackObjects (!dso) command, which gives me all of the object instances on the stack.

Looks like the application in question was using an Infragistics library, but the thing I was really interested in was the bottom one, the WinFormsAppContext, which was an instance of an ApplicationContext. From that instance, I could run the !do (dump object) command to see details about it.

From there, I wanted to find which mainForm it was using. I ran !do on the Value column of the mainForm instance.
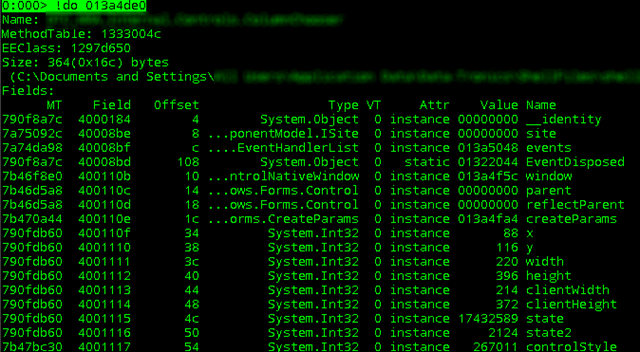
Nice! Now I know the name of the instance that was loaded! At this point, I’ve got a much better idea about what is going on and can now start digging through some code to try to determine what it is doing.
The rest of the story is fairly boring because, after opening the offending code, I spotted the problem fairly quickly. The hang, if you even want to call it that, had nothing to do with threading. It just looked like the application was hanging because, in the Form’s Closing event, the application in question was cancelling the close and hiding itself. I have no idea why, but I guess that’s debugging for you.
To finish off, I’d like to share some excellent debugging resources, particularly with WinDbg.
- Anything from Tess’s blog. Period.
- John Robbin’s blog
- John Robbin’s Debugging Microsoft .NET 2.0 Applications - awesome book on debugging.
- Johan Straarup has a great post on getting started with WinDbg.
- David Douglass’s WinDbg / SOS Cheat Sheet
Hope this helps!